By Jonathan Rogers, Co-Managing Partner, Wealth Advisor Alliance; Co-Managing Partner, Forum Financial Management; and Co-Chair, Forum Investment Committee
In this paper, I dive deep into the recent underperformance of value relative to growth. I frame just how unprecedented it is from a historical perspective and then take a data-driven approach to try to answer the question of whether we should expect it to continue or not in the future.
The coronavirus has exacerbated the longest-running underperformance for factor-based investing. It is a challenging time to stay invested in the strategy when value stocks, small-capitalization stocks and relative-profitability stocks have all three underperformed, albeit to a different degree.
The best known of the three, commonly referred to as value investing, has been especially hard hit. Going into this year, value stocks were already experiencing their worst 10-year difference in return compared to growth stocks in the history of the Russell Value and Growth indexes. Then in the first six weeks of the year, value was hit with the worst six-week period in recent history on top of that poor 10-year period. One well-known value investor, AQR Capital Management, looked at this going back to 1963 using Fama and French’s HML data and determined that this six-week period is in the worst 1 percentile of returns in the history of value and growth stocks. That is pretty bad.
It inevitably leads us to the question of what is causing such a widespread gap between value and growth. In short, we do not have a clear answer. But we rarely do when it comes to stock returns. In the short term, we have a more clear answer: Value stocks tend to do worse on average during a market decline than growth stocks. This is especially true for those declines involving worsening economic conditions, which may put greater strain on companies that were already priced at a discount relative to their competitors going into the downturn. But value stocks also tend to recover market capitalization more rapidly when fortunes reverse.
As far as explaining the 10-year drawdown of value relative to growth, a number of explanations have been offered. These range from the effects of globalization to low interest rates and even justifications similar to those we saw during the tech bubble about the dominance of tech firms in a more digitized world.
We tend to look at history rather than extrapolating on anecdotal theories. What we can say from history is that there seems to be two parts of the return difference. Value companies have done worse than they usually do, and growth companies have done better. It seems simple, but it is an important point.
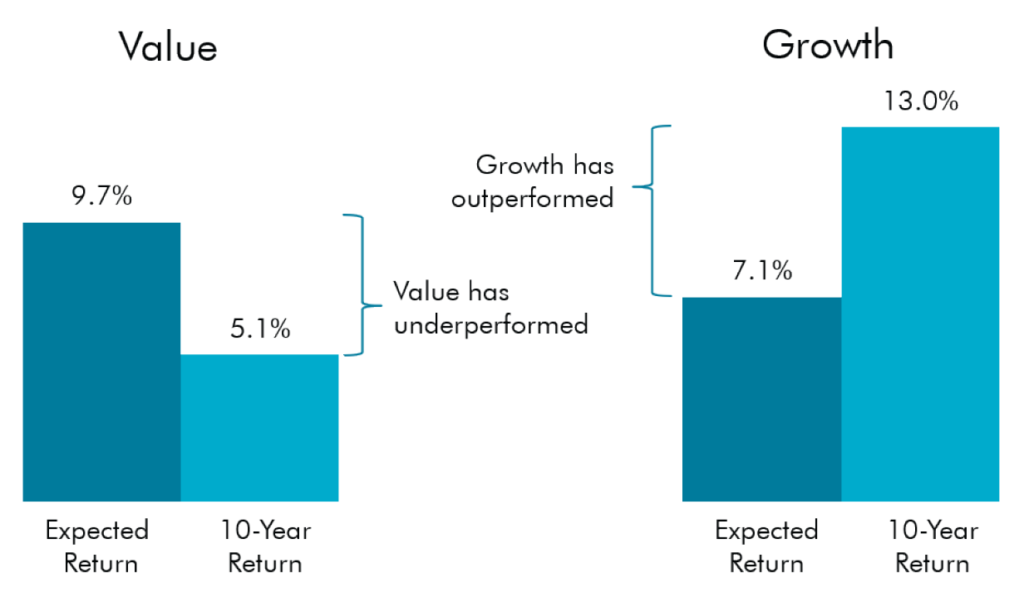 Figure 1
 Interestingly, the outperformance of growth has not come from higher earnings of growth companies compared to value companies during the same time period. The return on equity (ROE) for both value and growth companies has declined since 2007 at virtually the same rate.
Instead, the outperformance has largely been a stock price increase, as opposed to changes in any fundamental book or profit metrics. The price of growth stocks has risen dramatically over the past 10 years, while the price of value companies has stayed relatively flat.
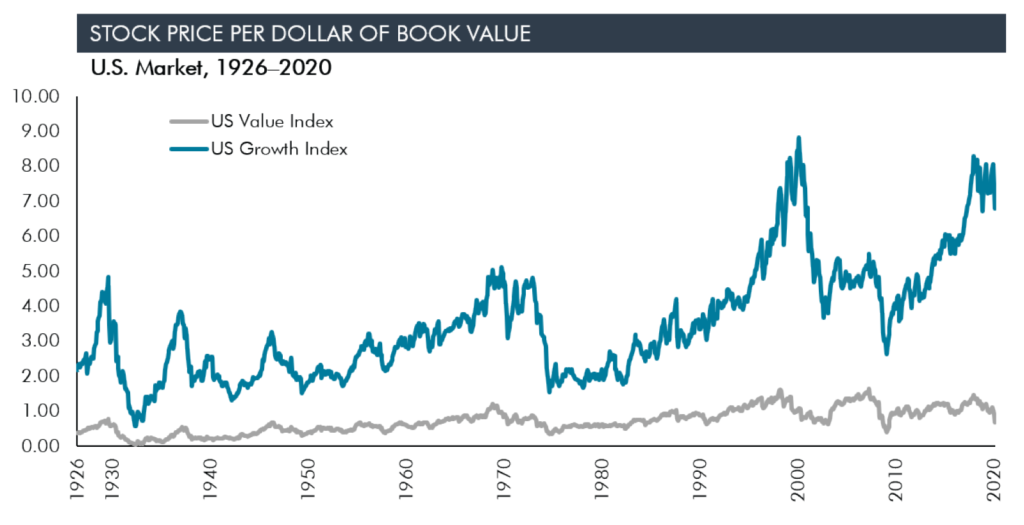
Figure 2
Winston Churchill said, “The longer you can look back, the farther you can look forward.” While value stocks have slightly higher valuations than the historical average, the growth valuations only have one other comparable period in history: the period leading up to the tech bubble. During that run-up, when growth stocks outperformed all others by double-digit numbers, the spread between value and growth was comparably wide. As we all know, that reversed sharply in the opposite direction during the crash and during the boom years after, which favored value companies.
Looking at the performance for the same period at the rolling 10-year returns of value and growth, here is the picture of value and growth performance differences over time.
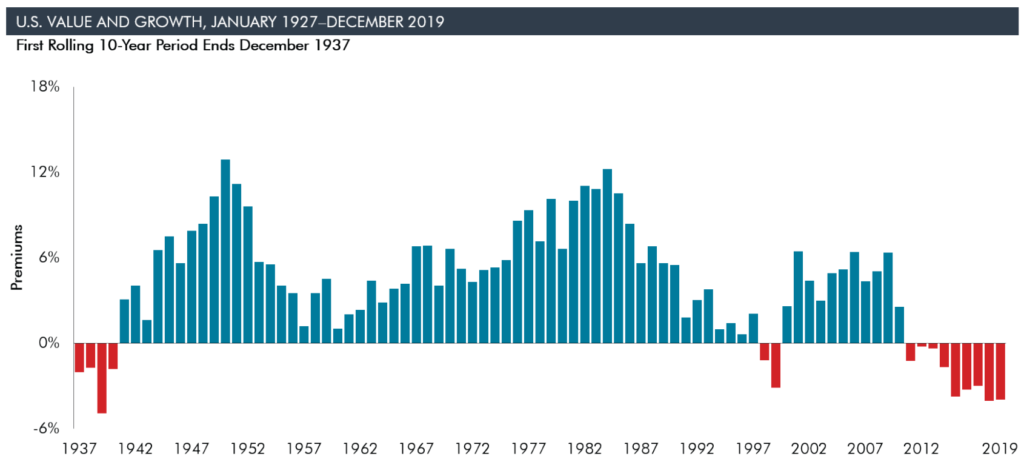
Figure 3
Here is an important concept to understand: If you have been invested in a value strategy and abandon it, you have made a decision to buy growth. Even if you sell value and buy a market index, on a net basis, you have bought growth stocks. From that perspective, the decision becomes a relatively risky bet. The odds of growth outperforming any 10-year period are historically 18% based on rolling 10-year returns since 1926. Additionally, as we have already covered, its valuations are at all-time highs suggesting the expected return is likely even lower than normal.
As we often say, the hardest part of investing is not having a good plan going in. It is sticking with that plan during the worst of times.
To explore the concept of staying invested, we can look at these returns on a year-by-year basis rather than rolling 10-year returns. This can give us a sense of just how difficult it can be to stay invested in any premium, whether that be the stock market premium as a whole, or any of the three-factor premiums mentioned earlier.
In every premium, there have been multiple periods of time when investors looking back at their portfolio would have said, “I just had a really bad ___ years. Maybe I should do something different.” Unfortunately, no diversified investment strategy we have looked at is immune. At some point, you will question whether or not to stay invested.
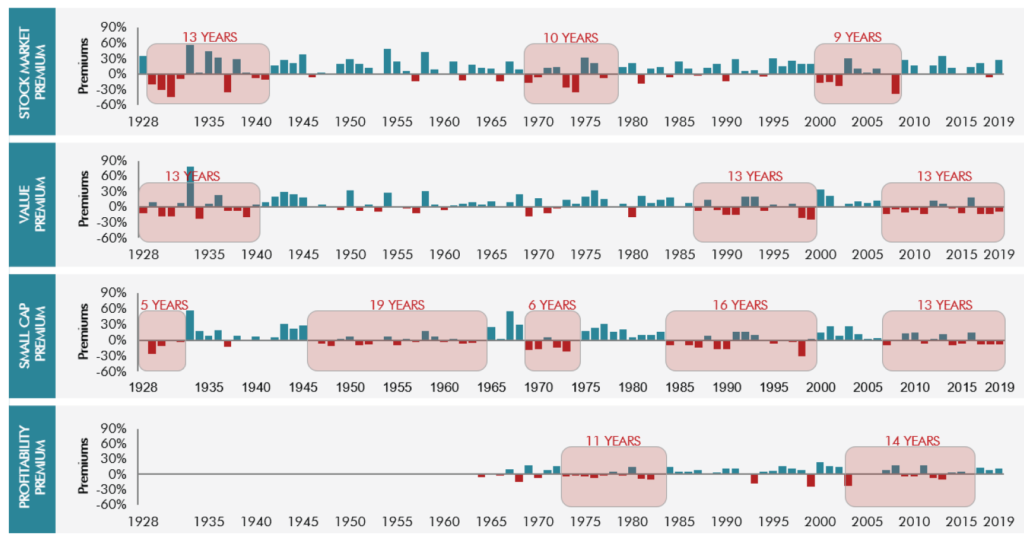
Figure 4
This highlights the trouble with risk. In the moment, it is always unforeseen. We must keep in mind that the reason we get compensated for taking on stock market risk, or any of these other premiums, is because we are compensated for taking that risk. If it did not exist, we as equity investors would probably deserve much lower returns over the long term.
Does It Matter?
The cumulative effect of investing in value versus investing in growth is what matters. The following chart shows the cumulative wealth of a value investor relative to a growth investor. At its peak, a value investor would have accumulated 30X the wealth of growth investor. That has declined to only 12.5X the wealth as of March 31, 2020 due to the more-than-10-year decline.
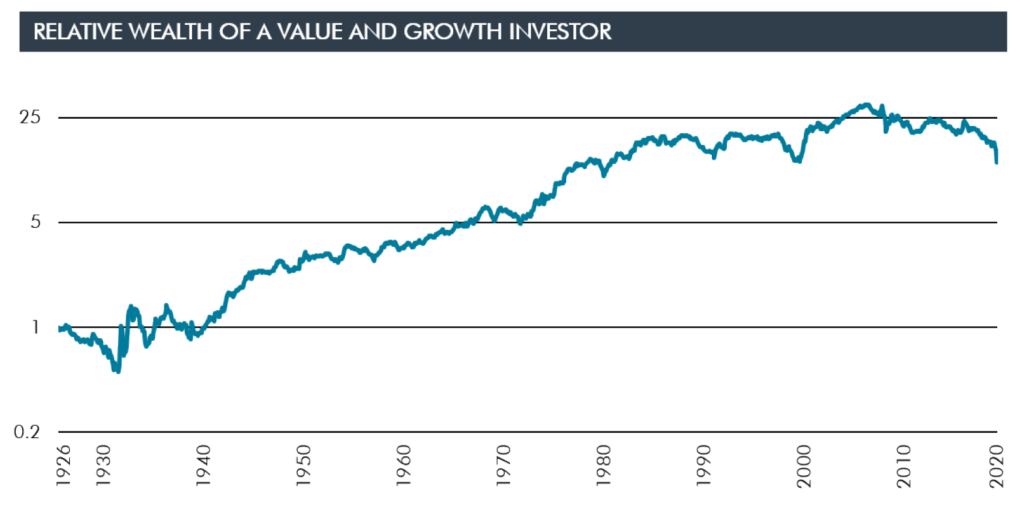
Figure 5
This chart more than any other shows just how extraordinary this drawdown in value relative to growth has been in historical terms. However, there are two other comparable time periods, in terms of periods when value investors seriously questioned their investment strategy. The first occurred in the 1920s when value stocks repeatedly took a beating compared to growth stocks, with three successive and very steep drawdowns. The other is the period we previously alluded to, which is the 1990s leading up to the tech bubble. This is not the first time that value has been out of favor, but it is certainly the longest.
If you find yourself saying, “OK, but 1926 was a long time ago,” then we have included one more chart showing the same data but shortened arbitrarily to the period since 1963, after which there is more robust accounting data in research databases.
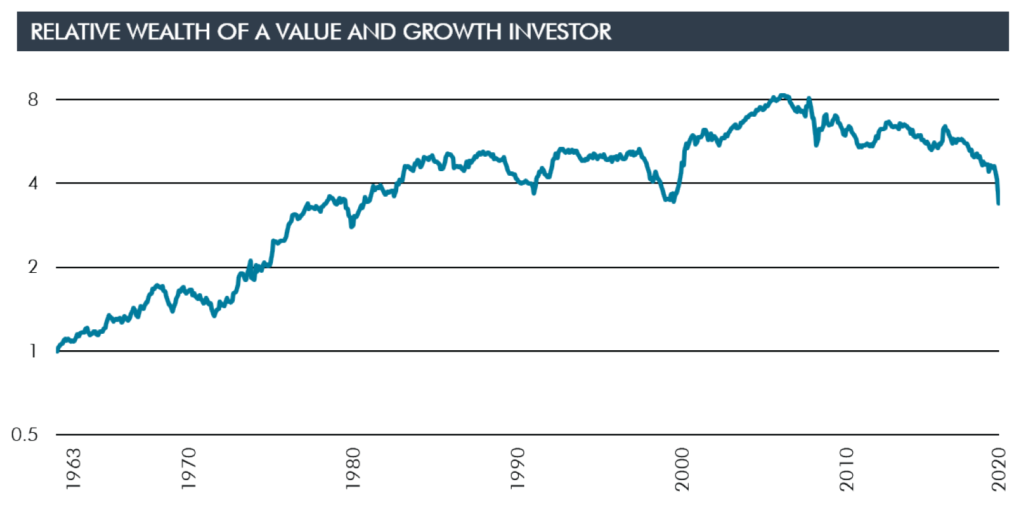
Figure 6
The conclusion is that value investors since 1963 had compounded over 8X the wealth a growth investor would have compounded, but this 10-year drawdown has reduced that difference to a little less than 4X the wealth. Our hypothetical investor, however, would still have been far better off investing in value rather than growth stocks.
Explanations for the Recent Gap
We also wish to address a few common explanations for why value may not perform well going forward. For this, we will draw upon a number of charts from two classic value investors: Dimensional Fund Advisors and AQR Capital Management.
If you are not already exhausted by now, I would strongly recommend the article “Is (Systematic) Value Investing Dead?” from Cliff Asness, which is a tour de force on this same topic. It is so good that I am going to directly summarize a portion in this article. He addresses at length a number of common explanations related to what kinds of companies are driving the effect, which I will cover in rapid-fire fashion for expediency.
The value drawdown is not caused by the outperformance of FAANG stocks (Facebook, Amazon, Apple, Netflix and Google’s parent company Alphabet). It is not caused by the largest 100 companies. It is not caused by only the “growthiest” stocks. It is not driven by a specific industry, like technology. It is not sensitive to the definition of value, which means it remains a historic drawdown regardless of whether you define value using price to relative to any fundamental like book value, cash flows, earnings or sales.
In the article, Asness also shows that growth companies are not “doing better” than value companies any more than they always have been historically. You hear stories like how the global markets and technology have changed the game more so now than ever before, giving advantage to big companies like Google, Facebook and Apple.
The following chart he created shows the long-term difference between growth and value stocks related to the return on assets (ROA) and the gross profit over assets (GPOA), which respectively measure how much income or profit is produced per dollar of assets. Basically, it tells you whether value or growth firms are currently better positioned to generate income or profits than they have been historically. The long-term average for ROA is –5% and it is currently –4%, while the average for GPOA was –14% and we are at –14% now. This says that value companies generate less income/profit than growth companies but they always have, and the relationship is pretty close to where it has always been.
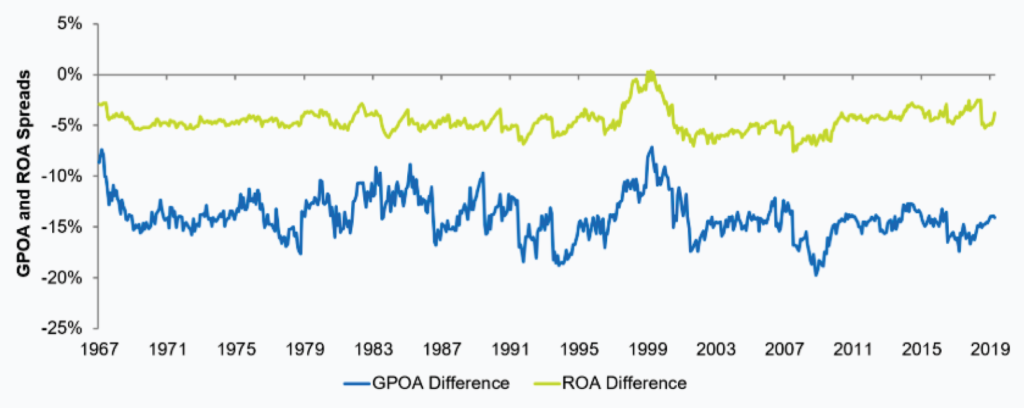
Figure 7
 Next, the article explores the leverage of firms. First, in a footnote, it explains that overall leverage is higher than it has been historically. But in terms of value relative to growth, the ratio of debt-to-book-equity stands at 66%, substantially below the 81% historical median value. This means value stocks are less leveraged than their growth counterparts on a relative basis than they have been historically.
Now we will depart from the AQR article and use data provided by Dimensional to explore a couple of other explanations: interest rates and inflation. The theory goes that low interest rates and inflation favor growth companies that typically generate more profits because their future profits are worth more. This relates to time value of money, as interest rates get used to discount the future profits. So, if rates are low, the discount applied will reduce the value of those profits less. Or alternatively, these large companies are able to borrow at such low rates that they can leverage their profits to higher levels. We addressed that aggregate leverage is about the same in the AQR data, but this looks more directly at the low level of interest rates.
There is a positive correlation between both interest rate level and changes in interest rates with the value premium. The charts below show a dotted trend line for this relationship for both three-month Treasuries and 10-year Treasuries. It basically says that value tends to do better when interest rates are higher or increasing. However, the relationship is very weak as illustrated by the wide variation of dots above and below. It also does not mean that the relationship should be negative at zero interest rates, but rather that, at worst, it may be indistinguishable from zero. For the stats geeks, the t-statistic of the 10-year is 1.99 but the R2 is only 1%. That means that, while very close to statistically significant, the level of interest rates only explains 1% of the differences in returns between value and growth.
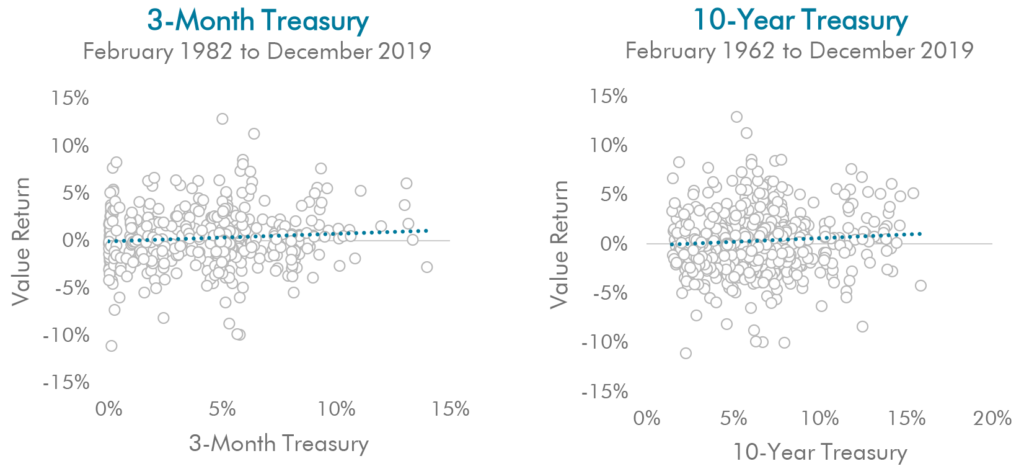
Figure 8 and Figure 9
If you look at changes in rates rather than the level of rates, the trend line would indicate that you would need to have a reduction of more than 5% for the weak relationship to start suggesting growth should beat value. Similarly for inflation, it would have to be more than 5% deflation (not inflation but deflation!) before the relationship would go negative.
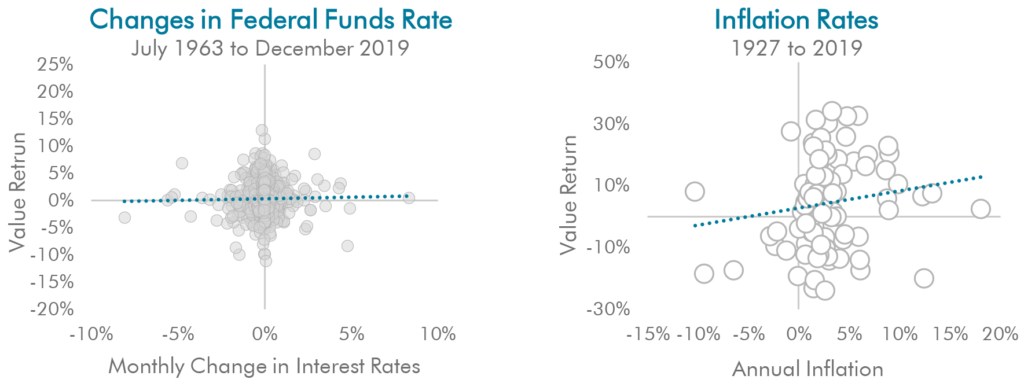
Figure 10 and Figure 11
More importantly, across the measures of interest rates and inflation above, the relationships have extremely little explanatory power.
Take It Back Up to 50,000 Feet
We have gotten deep into the weeds, but before concluding, I would be remiss in not addressing the theoretical roots of our conviction for why value should outperform growth in the long run. Decades of financial research have shown that financial markets do a fairly good job of determining relative risks of different companies. This is true of both debt markets and stock markets.
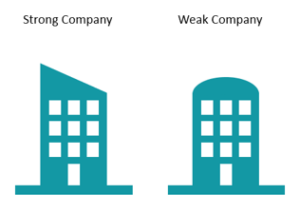 Consider this simplistic example of two companies. Pretend you are a lender. To which company would you charge the higher interest rate? Obviously, you would demand a higher interest from the weaker company as you may be concerned about its ability to pay, or the chance of default.
In our single-company analogy, the higher interest rate is equivalent to each company’s stock price relative to a given fundamental value. In the case of value versus growth, that metric is book value. Value companies are the companies that have low prices for each dollar of book value, and growth companies have high prices.
In the long term, if stock markets do even a reasonable job of pricing risk, the companies priced as being riskier, or in other words, those with “cheaper prices,” should deliver higher returns.
Conclusion
 The value premium has had its longest period of underperformance in history. It is quite likely the greatest predicament we will face as value investors in our lifetimes. Do we stay the course after more than a decade of relative underperformance, or do we justify a change in our strategy?
There is one investing lesson that has always been easy to write on paper and nearly impossible to live out. Often, the highest expected returns occur after the worst drawdowns. That applies to stock markets and value premiums equally. The reason it is hard to live in practice is that we never know when the worst is behind us.
We do not know if the worst is behind us. Growth may have more stellar years ahead. But with the insights of everything we have presented herein, and wisdom we have received from other value investors like AQR and Dimensional, we at Forum strongly believe that value stocks are positioned for high expected returns over the next 40 years. We plan to stay on the course we set for ourselves and for our clients.
*************
Contact WAA Advisor Development Officer Brian Shapiro if you are interested in obtaining these slides in a PowerPoint format. View article in PDF format.
We help advisors establish and grow successful wealth management practices. To learn more about how we can help you amplify your life’s work, contact us at team@waalliance.com. You can follow us on Twitter@theWAAlliance and on LinkedIn.
Sources
Figure 1: Expected returns are lower today than historical average returns due to lower interest rates, lower earnings growth and higher price-to-adjusted-earnings valuations. The expected returns above are for illustrative purposes and are the historical average return of the Fama/French Research Indexes for Value and Growth, both of which are adjusted down by 2.5 percentage points. Actual returns may be lower.
Figure 2: Dimensional Fund Advisors. Indices are not available for direct investment. Index returns are not representative of actual portfolios and do not reflect costs and fees associated with an actual investment. Past performance is no guarantee of future results. Actual returns may be lower. CRSP and Compustat data calculated by Dimensional. Fama/French portfolios provided by Ken French. Annual aggregate price-to-book ratios are computed as the inverse of the weighted average book-to-market value as of year-end.
Figure 3: Dimensional Fund Advisors. Indices are not available for direct investment. Index returns are not representative of actual portfolios and do not reflect costs and fees associated with an actual investment. Past performance is no guarantee of future results. Actual returns may be lower. 10-year premiums are calculated as the difference in annualized 10-year returns between the two indices described. Value minus Growth: Fama/French US Value Research Index minus the Fama/French US Growth Research Index.
Figure 4: Dimensional Fund Advisors. Indices are not available for direct investment. Index returns are not representative of actual portfolios and do not reflect costs and fees associated with an actual investment. Past performance is no guarantee of future results. Actual returns may be lower. Yearly premiums are calculated as the difference in one-year returns between the two indices described. Market minus Bills: Fama/French Total US Market Research Index minus the One-Month US Treasury Bill, which is the IA SBBI US 30 Day TBill TR USD, provided by Morningstar. Small Cap minus Large Cap: Dimensional US Small Cap Index minus the S&P 500 Index. Value minus Growth: Fama/French US Value Research Index minus the Fama/French US Growth Research Index. High Prof minus Low Prof: Fama/French US High Profitability Index minus the Fama/French US Low Profitability Index. S&P data © 2020 S&P Dow Jones Indices LLC, a division of S&P Global.
Figure 5: Indices are not available for direct investment. Index returns are not representative of actual portfolios and do not reflect costs and fees associated with an actual investment. Past performance is no guarantee of future results. Actual returns may be lower. Indexes shown are Fama/French Research Indexes for value and growth.
Figure 6: Indices are not available for direct investment. Index returns are not representative of actual portfolios and do not reflect costs and fees associated with an actual investment. Past performance is no guarantee of future results. Actual returns may be lower. Indexes shown are Fama/French Research Indexes for value and growth.
Figure 7: Cliff Asness, “Is (Systematic) Value Investing Dead?” AQR.com, May 8, 2020.
Figure 8: U.S. Treasury data provided by FRED, Federal Reserve Bank of St. Louis. Interest rate levels are the beginning of month constant maturity rate for the 10-year, 2-year, and 3-month U.S. Treasury, respectively. Value is the contemporaneous monthly returns on the Fama/French US HML research factor. Data provided by Fama/French. Eugene Fama and Ken French are members of the Board of Directors of the general partner of, and provide consulting services to, Dimensional Fund Advisors LP.
Figure 9: U.S. Treasury data provided by FRED, Federal Reserve Bank of St. Louis. Interest rate levels are the beginning of month constant maturity rate for the 10-year, 2-year, and 3-month U.S. Treasury, respectively. Value is the contemporaneous monthly returns on the Fama/French US HML research factor. Data provided by Fama/French. Eugene Fama and Ken French are members of the Board of Directors of the general partner of, and provide consulting services to, Dimensional Fund Advisors LP.
Figure 10: Dimensional Fund Advisors. Past performance is no guarantee of future results. Effective federal funds rate data provided by FRED, Federal Reserve Bank of St. Louis. Data represents monthly factor returns against contemporaneous monthly changes in effective federal funds rate. Factors shown are not available for direct investment; their performance does not reflect the expenses associated with the management of an actual portfolio. Eugene Fama and Ken French are members of the Board of Directors of the general partner of, and provide consulting services to, Dimensional Fund Advisors LP.
Figure 11: Dimensional Fund Advisors. Sample period: 1927 to 2019. Fama/French portfolios formed on book-to-market ratio. High minus Low calculated as the annual return difference between top 30% minus bottom 30%. Inflation is measured by the annual percentage change in the US Consumer Price Index. Eugene Fama and Ken French are members of the Board of Directors of the general partner of, and provide consulting services to, Dimensional Fund Advisors LP.
Nothing in this publication should be construed as investment advice. All information is believed to be from reliable sources; however its accuracy and completeness and the opinions based thereon by the author are not guaranteed and no responsibility is assumed for errors and omissions. Any economic and performance data published herein is historical and not indicative of future results. All rights reserved. Please consult your personal advisor and investment prospectus before making an investment decision.
By clicking on a third-party link, you will leave the Wealth Advisor Alliance website. We are linking to this third-party site to share information in a different format and is for informational purposes only. However, we cannot attest to the accuracy of information provided by this site or any other linked site and do not endorse the site sponsors or the information or products presented there. Privacy and security policies may differ.